Matt Lythe, Managing Director, Lynker Analytics
Solar power in New Zealand is on the rise. According to the Electricity Authority, New Zealand had more than 34,000 grid-connected photovoltaic (PV) installations at the end of August 2021, a total combined install capacity of over 170 MW. Overall, around one in fifty homes in New Zealand now have an installed solar system with around 500 new systems being connected every month.
While this is an acceleration on previous years, it is a long way from the half million homes Greenpeace called for in their 2018 ‘solarisation’ of the suburbs plan. In their plan the environmental lobby group called for even faster adoption to tackle the threat of climate change, increase the resilience of our power grid, and deliver lower bills for households.
The Sustainable Energy Association of New Zealand (SEANZ) is also urging Kiwis to take up solar and batteries as a path to energy independence and reducing carbon emissions. The benefits of solar were highlighted this winter as thousands of households across New Zealand experienced power cuts because of grid supply shortages while earlier in the year prolonged dry spells resulted in low hydro-dam lake levels and increased energy costs.
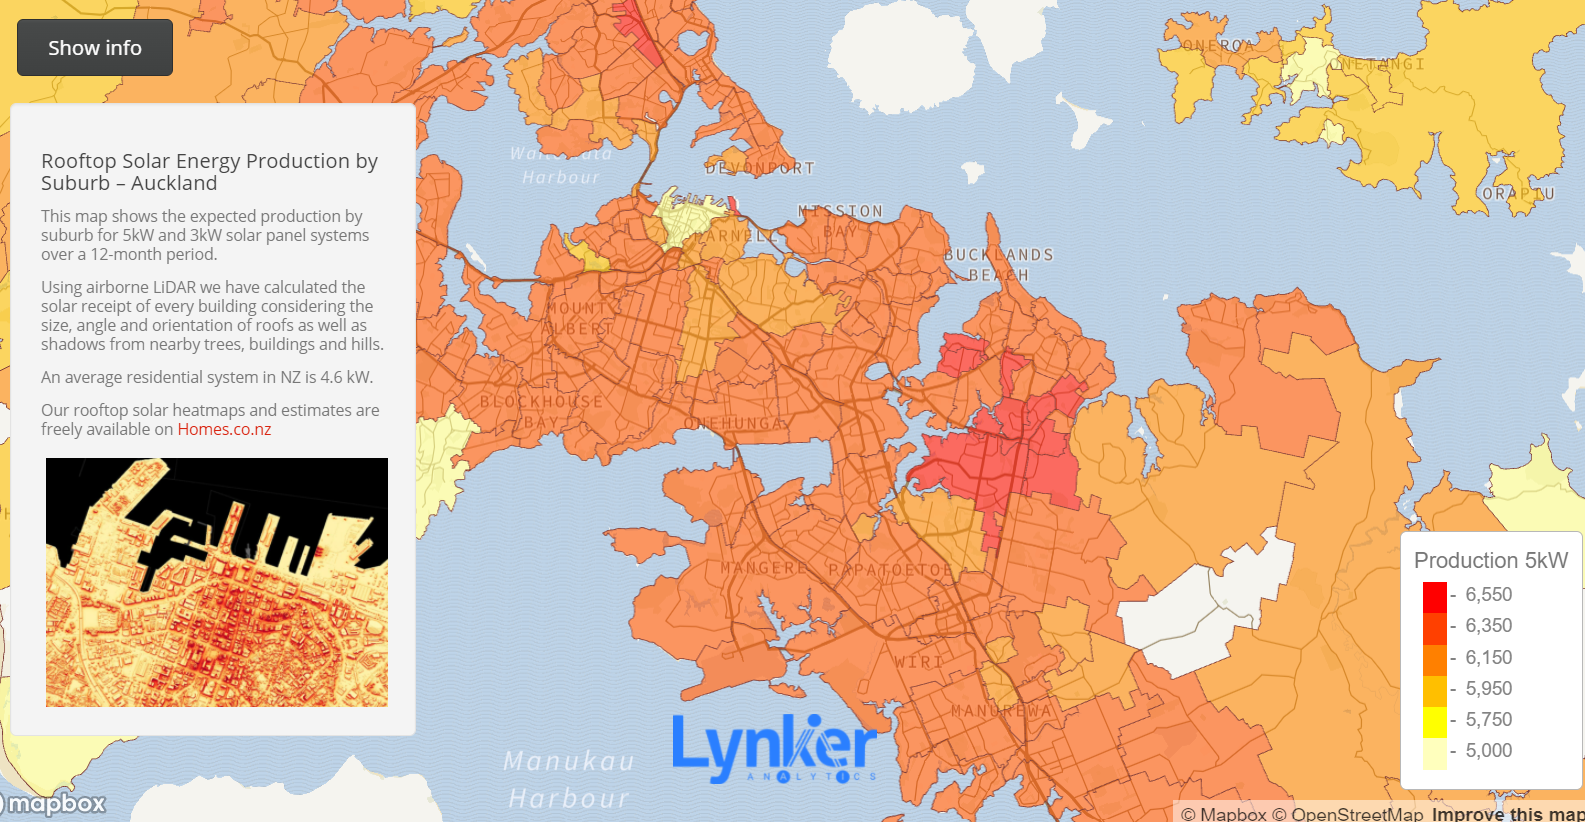
So, what can a typical solar system produce and where are the best suburbs for installation? We have crunched the numbers for every rooftop in our largest city and developed this interactive map that reveals the Auckland suburbs that are ideal for solar investment.
Our model uses LiDAR data to calculate the solar receipt of a building considering the size, angle and orientation of the roof as well as shadows from nearby trees, buildings and hills. From this we can predict the annual production from different sized solar arrays. We have calibrated the data using production information from solar installations completed by Harrisons Energy.
In our interactive map we show the average rooftop energy production for a 5kW and a 3kW system across every suburb. An average residential system in New Zealand is 4.6 kW. The suburb value is essentially the expected annual energy production a household is likely to get in that area.
The data shows that many well-established and affluent inner-city suburbs such as Parnell, Epsom and Remuera are not as well equipped for solar returns as other areas in the south-east and north. This is a result of shading impacts from trees, nearby buildings and hills. Conversely suburbs like East Tamaki, Papatoetoe, Flat Bush, Pukekohe and Pokeno exhibit very high solar returns with a 5 kW system generating almost 7000 kWh per year.
Several North Shore suburbs also rate well including Rosedale, Silverdale and Long Bay. In these areas production is close to the mean annual household energy consumption of 8000 kWh.
For many of these areas this sounds great but of course the best way to maximise financial returns for households is to use the power your roof generates in the home. However, there will be times when the solar panel system generates more power than the home can use. A battery investment will provide even more resilience but without a battery when this happens, that excess generation is exported to the grid at a lower rate than the price the household pays a retailer.
If we look more closely at the solar surface in two contrasting suburbs, Manurewa East and Laingholm we can see the impact of hilly terrain and tree canopy casting shadows in the western suburb while in Manurewa East which is comparatively flat and open, solar receipt is uniformly much higher. We should note an installer can counter some local shadow impacts by positioning panels with an adjusted tilt angle.
Overall, the data shows which suburbs are well suited for low or zero carbon home energy, meaning lower bills and energy independence, but also how households can contribute to the council’s Auckland Climate Action Plan. Dollar savings using a Harrisons Energy solar system for over 1.5m buildings across New Zealand are visualised and available free at a property level on homes.co.nz.


