Farm-specific climate risk assessments

Client: Pāmu Farms of New Zealand

Pāmu is a State Owned Enterprise and the largest pastoral farmer in Aotearoa New Zealand managing nearly 360,000 hectares across more than 100 farms including the Wairākei Estate dairy complex between Rotorua and Taupō and the largest station in New Zealand, Molesworth, which is on land leased from the Department of Conservation. 

Like many farmers Pāmu operations are exposed to physical climate risks due to the direct reliance of agricultural production on climate systems. Extreme weather events can cause crop failures, death of livestock or significant reductions in yield. Increased severity and frequency of extreme weather events may result in financial losses at the farm level.

In 2023 Pāmu commissioned data science experts Lynker Analytics and New Zealand experts in extreme weather and climate change, Professor David Frame (University of Canterbury) and Dr Luke Harrington (University of Waikato), to help understand vulnerabilities to climate risks such as drought, heavy rainfall and extreme heat across their farms. 
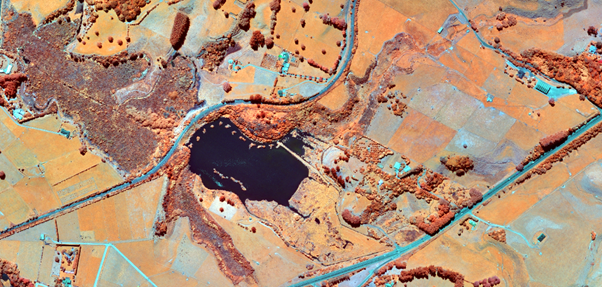
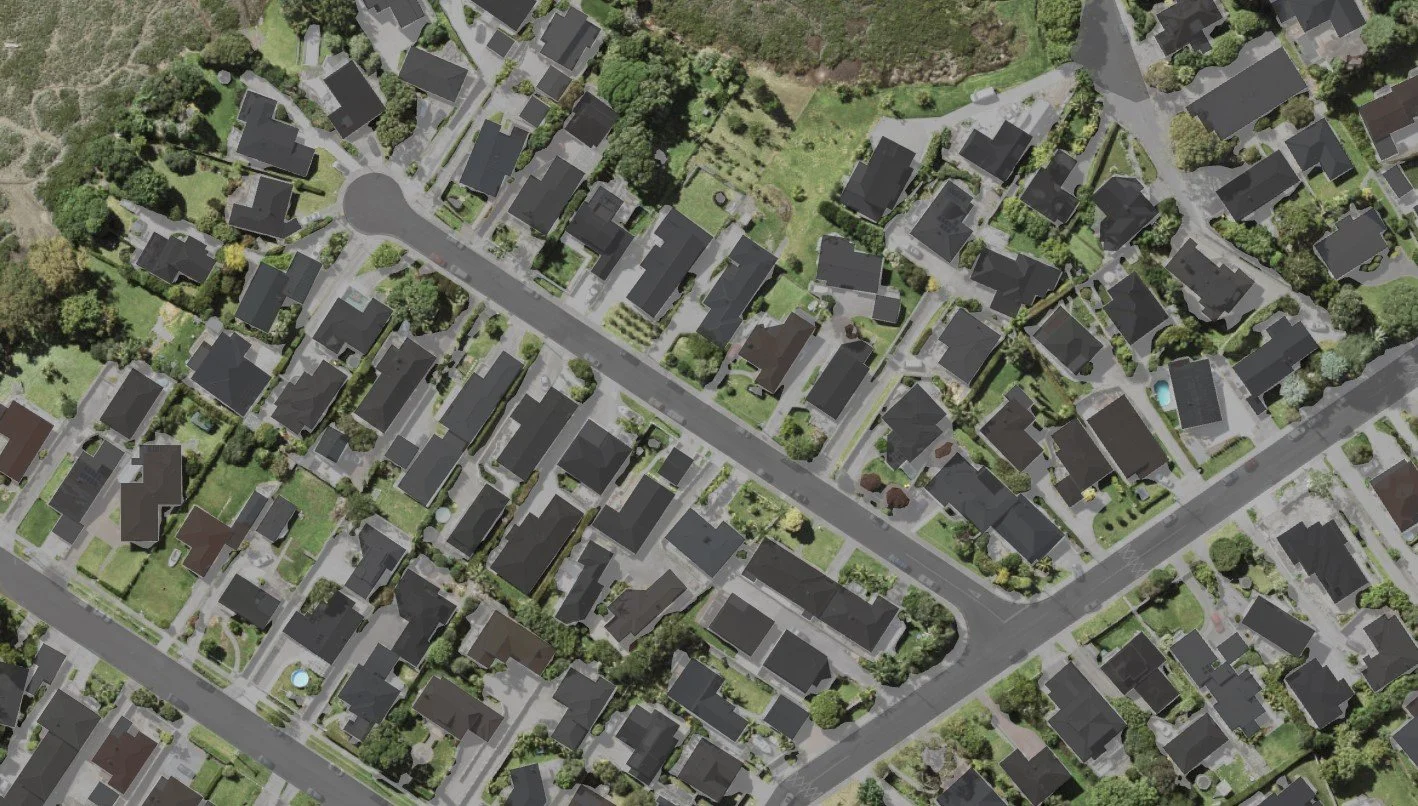
Photo: Kaeli Lalor

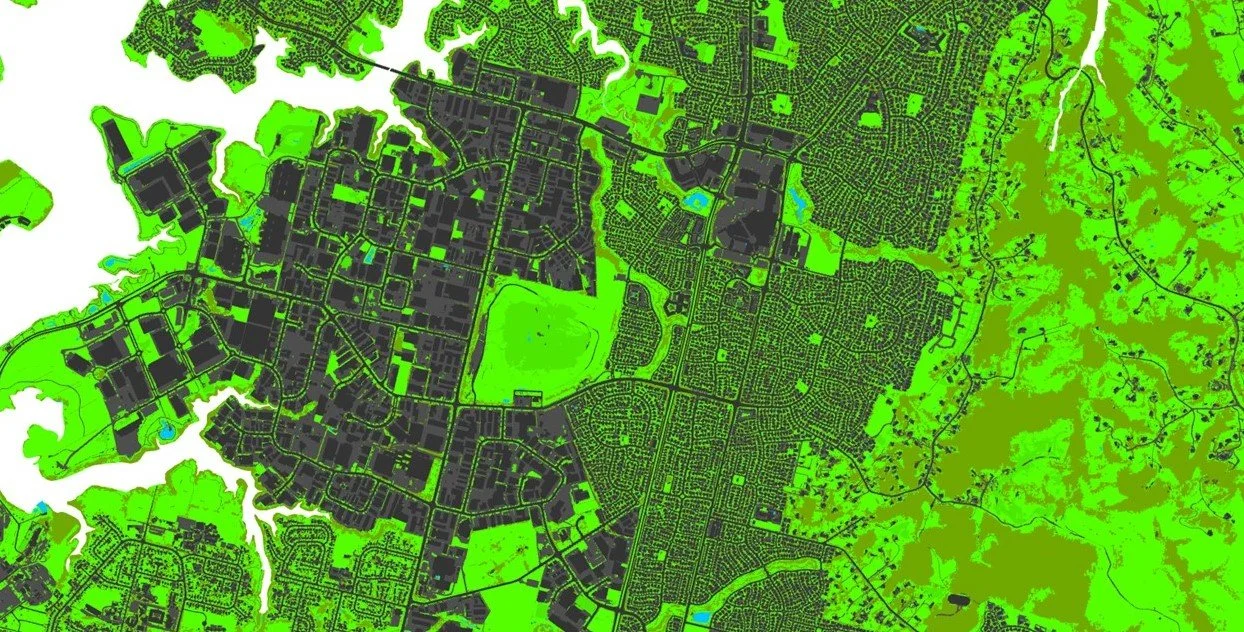
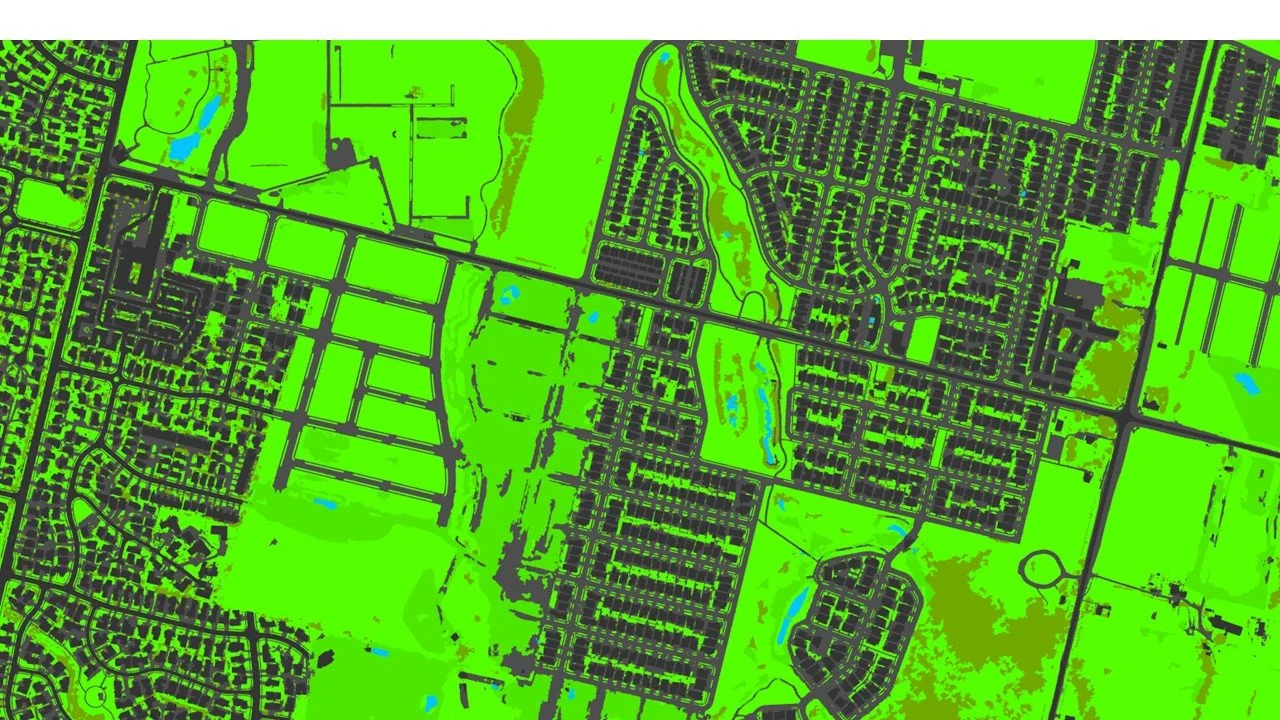
Our team used a Climate Risk Vulnerability Assessment (CRVA) method to identify the direct and indirect effects of climate change, as well as non-climate stressors. This method is used internationally to assess community, asset and species vulnerability to climate risk which arises as a result of the confluence of hazards, exposure, and vulnerability.  

A climate hazard becomes a climate risk when inhabitants and/or assets are exposed to the particular hazard and if those exposed inhabitants or assets are vulnerable to it. A farm or business can improve its resilience and adaptive capacity to climate-related shocks and stresses by implementing climate adaptation actions. However, it is necessary to develop a sound understanding of context-specific climate risks before developing such actions.

This research highlighted the likely land use, production and performance impacts on each farm under climate change using a +1.8°C by 2050 scenario. The study involved the characterisation, diagnosis and projection of risks or impacts of environmental change on farms, systems, land use and infrastructure.  

A matrix of risk for each farm along with a technical report outlining data inputs, scientific method, risk analysis and summary data was part of the delivery, and farm data and planning advice was provided to Pāmu for internal  use or ongoing modelling and adaptive planning. Pāmu staff supported the study with the provision of data and discussion groups.

An example summary sheet shared within the 2023 Pāmu Climate-Related Disclosure is shown below.

Example Pāmu Farm Risk Assessment

This work was delivered by Lynker Analytics at the end of 2023 and over the course of 2024 Pāmu has used this research to form a Pāmu adaption plan. This year the Lynker team has been supporting the sustainability  team at Pāmu to present and explain this research at regional workshops. 

Pamu Climate risk adaptation presentation on farm. Source. Sam Bridgman

Pāmu Head of Sustainability, Sam Bridgman explains “this study has helped Pāmu identify which farms have greater risks and opportunities from climate change in the near and medium term. It has allowed us to prioritise our adaptation actions. ”

As a result of this work the most vulnerable farms have become the initial focus of adaptation planning with the climate risk reports providing an important step forward in farm-by-farm resilience planning. 

For more information on how Pāmu is preparing for a changing climate please see the 2023 Pāmu Climate-related Disclosure.

Impervious area mapping – Christchurch City

Client: Christchurch City Council

Impervious surfaces are important in the context of stormwater planning with the higher the impervious surface area in a catchment leading to a greater quantity and intensity of runoff.  The ratio of impervious area to pervious area within in a catchment is a good indicator of the level of effort urban planners need to manage water quality.

The impervious area of Christchurch City has been mapped in 2007 and 2012 (Pairman et. al., 2012), and 2020 (Christchurch City Council) using remote sensing classification methods applied to satellite imagery. 

In this project Lynker Analytics used modern Machine Learning methods to generate a new detailed impervious area map of Christchurch City including the outlying urban areas covered by the extent of the 2023 Christchurch 0.075m aerial imagery survey.

Impervious area map, Christchurch City

The impervious area map was a derivative from the standard Lynker multi-class landcover map which includes eight categories including water, bare earth, grass, shrub/scrub, trees, paved, road, and building. Our approach used supervised Machine Learning (ML) models developed and trained for high resolution orthophotography. These models have also been used by Lynker in other New Zealand cities including Auckland, Hutt City, Whangarei, Tauranga, Kapiti Coast and others. 

Our ML models can be transferred from area to area (or image set to image set) but to perform optimally need to be fine-tuned on the target imagery. The ML models generate a polygon feature class (prediction).  Ancillary GIS data including kerblines, water bodies, building outlines and road centrelines were then incorporated within our post processing and data assembly process.  

The impervious surface produced from this method includes all artificial structures—such as pavements, roads, sidewalks, driveways and parking lots, as well as industrial areas such as airports, ports and logistics and distribution centres, all of which use asphalt, concrete, brick, stone etc.  

The model reported an overall weighted average F1 score of 0.95.  The map generated using this method shows finer detail than the 2020 map which was generated using 10m resolution satellite imagery.

2023 impervious area map.

2020 impervious area map.

Validation data used to measure model performance were acquired by Lynker staff using aerial photo interpretation. Clear examples of each class were selected using the same imagery processed by the ML models. 

Central urban area (red)

Using this approach we determined that the total percentage of composite impervious surface throughout the study area represents approximately 20% of the land area while the impervious area in the central urban area was 60%. Both figures represent growth in the city from the earlier assessments.

Examples from the model including canopy, composite impervious area and the full multi-class landcover are shown below.

Central urban area

Lyttleton Port

Composite impervious and urban forest canopy

This work extends previous modelling we have done using urban ortho-photography and these models will support the future development of a longitudinal data set of change in imperviousness across Christchurch City.   

 Deliverables

  • Multi-class land cover GIS data

  • Impervious surface GIS data

  • Technical report

 References:

Pairman D, Bellis S, McNeill, S. Mapping of impervious surface cover for Christchurch City, 2012.  CCC commissioned Landcare Report. LC1811.


Monitoring high country transects with Machine Learning

Client: Environment Canterbury

Environment Canterbury (ECan) have been gathering photographic data of ground cover across grazed and destocked hill and high-country farmland in Canterbury continuously since the late 1970s.  This is part of a long-term programme called SPT (Stereo Photo Transects) which is designed to monitor the effects of soil and water conservation plans over time.

One of the study objectives was to determine whether destocking resulted in a decrease in bare ground.  ECan also put sites on grazed land that were similar to the destocked land to assess this management difference.  These sites consist of transects running across a landscape with ten photo points taken with a camera mounted on a tripod and pointed vertically downwards, with a field of view covering a few square meters of ground.

Locations of transects for long term ground cover monitoring.

Lynker Analytics was commissioned to develop a convolutional neural network (CNN) semantic segmentation model to automate the classification of each photo into its fractional ground cover to enable scientific interpretation.  

From around 10,000 images, approximately 1,000 photos were partially labelled by human annotators into four ground cover classes: Living, Dead, Rock, Soil.  The training data set included one thousand high resolution images, each with one thousand random point assessments (RPA) thus creating a training data resource of 1,000,000 labels covering a wide range of cameras, years, image resolutions and lighting conditions.

This diversity helps ensure robust learning and a generalized model that should perform well in different conditions.  To further help with model generalisation we also applied random transformations to the training imagery including:

  • up-down and left-right reflections.

  • brightness reduction or increase

  • contrast reduction or increase.

  • hue reduction or increase (effectively shifting the colour)

  • saturation reduction or increase (changing the colourfulness)

We use the DeepLabV3+ CNN architecture for semantic segmentation which is a well-known and efficient CNN for semantic segmentation that has demonstrated high accuracy on land cover tasks.

Example images, training points, and inference are shown below. Red = Dead, Green = Living, White = Rock, Blue = Soil.

Example of images, training points (RPAs), and inference output

The models developed as part of this research allowed for automated inference across the whole photo archive and consistent classifications across time.

Site1 over time, photos, RPAs, and inference

The output of the model inference gives us coverage by site and camera position for the four classes. A benefit of this inference is the ability to model ground cover over time at a particular site. Taking one photo site as an example, the trends over time and comparison of RPA and machine learning predictions for two of the four classes can be seen by plotting the fraction of ground cover per class over time.  We see a good correspondence between the inferred ground cover from the machine learning process and the estimated ground cover from the human labelled RPAs.

Site 1 - predicted versus labelled for Dead and Living classes.

The model has shown good results (equivalent or better than the human annotations) on the RPA classified subset of images from the Transect photo archive and demonstrated the usefulness of sparse point-based training.  Application of these models has increased the number of classified photos from 1,000 to the full photo archive.  This allows the SPT project a more complete analysis of ground cover trends across all sites over time and a consistent and automated ground cover detection process for future years.  The model and code was provided to ECan enabling them to run the models on photos in future years either with Lynker’s help or independently.          

Deliverables:

  • Ground cover fractions and statistics in csv format.

  • Rescaled photos

  • ML output images with class label pixel values

  • ML output images with classes depicted by visible colour.·      

This work was also published at the 38th International Conference on Image and Vision Computing New Zealand (IVCNZ) – citation below.

D. Knox, B. Xue, M. Zhang and J. Cuff, "Measuring Ground Cover in Long Term Hill Country Photography using Weakly Supervised Convolutional Neural Networks," 2023 38th International Conference on Image and Vision Computing New Zealand (IVCNZ), Palmerston North, New Zealand, 2023, pp. 1-6, doi: 10.1109/IVCNZ61134.2023.10343908.

Modelling roof condition with deep learning

Client: Christchurch City Council

Roof runoff is an important source of urban stormwater contamination in cities with the material and condition of roofs both impacting the quality of runoff entering the stormwater network. 

Christchurch City Council worked with AI provider Lynker Analytics (Lynker) to develop an automated and explainable Machine Learning model to predict roof material and condition across the city.

Christchurch City residential roof tops. Photo credit: Hannah Currie

Lynker initially used a deep learning model trained on high resolution aerial photography captured in 2020 and 2021 to classify roof material e.g. coloursteel, galvanised, metal tile, non metal and predict their condition e.g., good, average, poor.  This model was trained on around 1000 buildings, and its accuracy was measured against field captured data. 

Examples of roof materials used in the modelling

An ensemble model was then developed using Explainable AI to combine predictions from both the deep learning model with property level data held by the Council, such as age, roof material at construction date and property type.

A supplementary study was also conducted to determine the proportion of zinc-coated roofs on industrial buildings and break down the sub class for all metal roofed buildings to include Coloursteel and Galvanised.

Example of an area with different roof materials. Photo credit: Hannah Currie

This approach allowed the Council to identify and understand the most informative attributes and data interactions needed to make the best overall prediction for each roof. 

Results from the deep learning computer vision model could be weighed against the information maintained on the property by Council.  Metal roofs which are generally the main source of contaminants were then assigned a decay index value with a higher value indicative that the roof is in poor condition.

Across the city, around 10% of buildings were found to have a poor condition roof with the best result achieved using an ensemble model which combined the deep learning and explainable models. 

The global explanations provided by Explainable AI described the most important contributing factors across all properties alongside the factors impacting local (rooftop scale) explanations.

 Deliverables

  1. City-wide data set describing roof type and condition

  2. Technical Memo explaining method and results

Riparian Planting Survival Assessment

Client: Ministry for the Environment

Riparian areas are the strips of land beside drains, streams, rivers, and lakes.  Riparian planting has multiple environmental benefits including water filtration, erosion prevention, moderation of water flow, shading waterways, providing habitat for indigenous species, and keeping livestock out of waterways.

As part of the Ministry for the Environment’s Mahi mō te Taiao | Jobs for Nature programme a combined Pattle Delamore Partners/Lynker Analytics team assessed the suitability of different remote sensing methods including satellite, airborne and unmanned aerial systems to monitor these ecosystems.

Figure 1. Schematic of typical riparian zones (adapted from Dairy NZ, 2014).

For each sensor, we developed Machine Learning (ML) techniques to identify and map the extent of plants within five distinct and differentiated riparian systems.  Planting data was collected in the field with the field schema including detailed vegetation categories to adequately record riparian survival. 

Figure 2. Modelling results by sensor in 5 riparian test sites

Based on overall visual comparison and model accuracy scores, the UAV model provided the best detection however the Maxar model offered the most consistent visual output and the highest mean average accuracy.  The first stage of the project therefore determined that high resolution satellite imagery from Maxar was the most suitable for a scalable monitoring system.  Stage 2 involved the implementation of a Maxar model over 141 sites in the Taranaki region.

We used a combination of methods to prepare training data.  First, PDP botanists generated a fully human annotated training dataset using super-pixels, then we used a remote sensing method called the Vegetation Texture Index (VTI) to create training data.  The remote sensing VTI model was prepared using a combination of spectral indices and a texture index. 

Figure 3. Remote Sensing training

We then combined these datasets to create the final training dataset which was used as input into a convolutional neural network or deep learning model to achieve semantic segmentation of the riparian ecosystem.

Figure 4. Model workflow

The final prediction model reported an overall classification accuracy of 72% against the validation data, however, with masking known waterways the model accuracy rises to 80% with unvegetated, woody and grass classes detected with F1 scores between 0.8 and 0.9. The model had difficulty resolving narrow features such as streams and herbaceous strips which affected the unvegetated and herbaceous classes. Masking of waterways, including narrow streams boosts the accuracy considerably and was recommended as a pre-processing step.

In conclusion, the developed model achieved the project objectives of determining riparian planting survival with an acceptable accuracy, mapping riparian vegetation into 6 distinct botanical classes.  The method can be applied to predict riparian planting survival across New Zealand.

Deliverables:

Data outputs include the modelled riparian vegetation classification maps and related attributes including coverage of each class and the plant stature classification. The output includes a feature class with detailed planting information of each site.  

The Technical Memo for the project is located within the Ministry for the Environment publications.

360 Video Stream Assessments

Joint project with Zealandia Consulting for: Whangarei District Council

The health and environmental state of New Zealand’s streams and rivers continues to decline due to natural and human influenced land use changes.  Monitoring remains essential to identifying issues and opportunities for improvement within our waterways.  Watercourse assessments are typically conducted throughout urban New Zealand using the Watercourse Assessment Methodology: Infrastructure and Ecology version 2.0.

In 2022 Zealandia Consulting was contracted by Whangārei District Council (WDC) to provide a stream assessment for the heavily modified 16.6 sq km Raumanga catchment. This modification includes straightening of channel meanders and reclamation of the historical floodplain.  The purpose of this assessment was to

  1. develop a baseline data to monitor ongoing change;

  2. provide key environmental and asset information for the network discharge consent applications; and

  3. enable a systematic approach to identify issues and options for remedial, mitigation, and improvement works.

Images of team and gear used on the Raumanga Stream-walk

Working in partnership with Lynker Analytics an opportunity was seen to refresh the assessment process using 360 video. A field survey was conducted by Damian Young (Zealandia Consulting) accompanied by Dr Manue Martinez (Chief Research Scientist of M2M Consulting) and Opania George (Te Parawhau Kaitiaki).

The assessment involved travelling (by canoe or on foot) up selected stream survey reaches.  Video and associated audio commentary was captured using a GoPro Max 360 Action camera. This provided a 360° view of the stream with the intent of capturing all stream assets and attributes for post desktop review.

GoPro Max 360 footage taken on the Raumanga/lower Waiarohia Stream

Additional photos of important assets were also taken using a Blackview BV9800 and iPhone 12 mobile phones. The data were stored on Zealandia Consulting’s corporate and backup drive.  Within each stream survey reach, information was also collected via an online field app (Esri Field Maps). The app was used to pinpoint locations of interest (e.g., asset outfall) to record their attributes and upload images. Additionally, desktop data population was completed using Web Editor via Esri ArcGIS® online.

This has enabled more effective data capture as well as seamless representation of deliverables for all parties to utilize efficiently in a wider range of ways.  An on-site stream assessment or stream-walk was conducted in August 2022, covering 14km of the Raumanga stream. Tools and technology used for the Streamwalk included a high resolution GoPro Max 360 camera and a data capture application developed and designed to capture data directly using a smartphone.

The navigable lower reaches were accessed by a well-equipped canoe and the higher reaches were accessed by foot. Post processing and tools developed enabled open-source access through Mapillary © (available in 3D imagery format) for sharing with the wider community. This approach has resulted in many benefits, integration opportunities, and insights readily accessible for stakeholders and the general public.

The Raumanga Stream view is publicly available on Mapillary.

Panoramic still images extracted from GoPro 360 footage, presented in Mapillary of Raumanga Stream.

The intent of the stream assessment is to inform other councils and organisations across New Zealand in order to share valuable insights which could be of benefit to many, but also to engage in active dialogue with other practitioners to continue improving the effective communication and utilization of cultural, environmental and engineering data to better inform understanding of our awa and the practical improvements to stream environments and infrastructure that are possible and needed.

This approach has resulted in many benefits, integration opportunities, and insights readily accessible for stakeholders and the general public.  It has enabled more effective d ata capture as well as seamless representation of deliverables for all parties to utilize efficiently in a wider range of ways.

Deliverables

  1. Raumanga/Lower Waiarohia Stream Assessment, Whangārei, Te Tai Tokerau/Northland

  2. Watercourse Assessment Report

  3. Raumanga Stream Geodatabase (Esri ArcGIS® pro)

  4. Esri ArcGIS® Pro Field app customised by Lynker Analytics for in stream data capture

  5. Raumanga GoPro 360 footage (Mapillary ©)

  6. Raumanga Stream Weed Management advice.

Modernising Auckland’s height data

Client: Auckland Council

For many years surveyors have measured heights in Auckland in metres above the Auckland Vertical Datum 1946 (AUK1946) which was established based on mean sea level in Auckland Harbour in 1946 and then extended across the city by leveling surveys along major roads.  However this system is difficult to maintain and is susceptible to movement caused by earthquakes.  It also means heights can be difficult to share between regions for national or inter-regional projects where other datums are in use.

To resolve this, a new vertical datum, NZ Vertical Datum 2016 (NZVD2016) has been established as a standard for measuring elevation nationwide. NZVD2016 allows for the consistent collection and seamless exchange of heights across New Zealand. NZVD2016 approximates sea level which has risen about 20cm globally since 1946, accounting for most of the datum difference between elevations in AUK1946 and NZVD2016. Toitū Te Whenua Land Information New Zealand (LINZ) is now encouraging local government agencies to migrate their geospatial data to use NZVD2016.

To help prepare for this change Auckland Council contracted Lynker Analytics to provide an assessment of the impact of this transformation to their data and procedures and the programme of work required. 

The project included the following activities:

  1. Produce / Extract LiDAR datasets in the AUK1946 and NZVD2016: DEM, DSM, Contours. 

  2. Identify test areas based on expected conversion variation across the area.

  3. Identify the datasets where there could be an impact of change. 

  4. Evaluate the impact of the new datum on all the reference datasets as outlined.

  5. Evaluate the overall impacts of the change including positional and vertical change, topology and data utility e,g. impacts on flow direction, pipe gradients, as-builts.

In our analysis we reviewed more than fifty geospatial data sets grouped into 7 categories including elevation, assets, freshwater, coastal and marine, survey and other/misc.  Impacts in a range of areas encompassing varied landforms, geology and land cover were then evaluated in detail. 

Analysis from Kumeu test area.  25cm topographic contours (top left), DEM (top right), overland flow and flood areas (bottom right), Asset data (bottom left).

Key findings include:

  • Most of the geospatial datasets that hold elevation attributes or are derived from elevation data sources can be safely and efficiently converted to NZVD2016 using standard GIS tools.

  • Conversion can be done in bulk including transforming all attributes in a single operation per layer, using the LINZ datum correction surface. 

  • Overland Flow Paths (OLFP) show sensitivity to datum changes for lower order (smaller) watercourses.  

  • Gradient changes in pipe assets, e.g. stormwater, as a result of the datum shift are minor.

  • The long-term spatial plan is future proofed for the datum change.

  • GIS metadata for elevation-related themes should be revised to clarify the vertical datum used for levels. Attributes for level data should be expressed in both AUK1946 and NZVD2016 datums for the foreseeable future.

Spragg Monument, Kakamatua – contour comparison.  The figure above shows Geomaps contours (orange) and contours from 2016-2018 DEM (red).

We also made the following recommendations to support the adoption plan:

  1. Auckland Council require all as-built plans to clearly express the datum being used

  2. Auckland Council migrate impacted GIS data using a standardised process. 

  3. Auckland Council transition to accepting as-builts using NZVD2016 immediately after Auckland Council’s GIS data are converted.

Geodetic marks in the Albany area. NZVD2016 (red), AUK1946 (yellow).

Generally there is a much higher and more even density of NZVD2016 marks especially in areas of urban development such as Albany shown here.

We also noted that as there is only a small (approx 30cm) difference between datums there is a risk of confusing data recorded in the two datums. This can be mitigated by ensuring the datum is expressed on all plans and in GIS metadata.

Deliverables:

  1. Sample data and transformations

  2. Technical report outlining the conversion impacts and the work programme required to undertake an Auckland-wide change.

  3. Briefing of results and implications 

 This fact sheet from Toitū Te Whenua Land Information New Zealand (LINZ) provides more information on the new datum. 

Wetland detection on the Kapiti Coast, NZ

Client: Greater Wellington Regional Council

Environmental science and engineering specialist Pattle Delamore Partners (PDP) and data science specialist Lynker Analytics produced the first high-resolution wetland detection map of the Kapiti Coast  using Machine Learning (ML), Light Detection and Ranging (LiDAR) and high-resolution Red-Green-Blue-Infrared (RGBI) aerial imagery.  The wetland detection map was designed to provide the initial response to the need for wetland mapping in the Kapiti Coast District for the Greater Wellington Regional Council (GWRC).

The Challenge

  • Detect and map wetlands 0.05ha and greater including coastal wetlands in the Kapiti Coast District

  • Provide an actionable wetland output to help with the prioritisation of wetlands at risk of loss of extent or values

  • Develop a cost-effective method to detect and map wetlands for potential application across the wider Wellington Region

Background

The National Policy Statement for Freshwater Management 2020 as part of the essential freshwater reforms require Regional Councils to identify and map every natural inland wetland in their regions, outside of public conservation lands or waters, that is ≥0.05 ha by 2030.  Furthermore, the policy statement provides direction that in doing so, regional councils should prioritise wetlands at risk of loss of extent or values.  Given the risks to wetlands posed by urban development plans for the Kapiti Coast District, the timing of work on the whaitua catchment committee plan, and the spatial resources available, the Kapiti Coast District was selected to trial the new wetland detection techniques.

Internationally the task of wetland mapping had been described as one of the most difficult  landscape features to map. Wetlands are dynamic and often transitional ecosystems; their interface with terrestrial  and aquatic ecosystems are challenging to understand.  Expert knowledge is normally required for designing and extracting the most efficient information and to discriminate wetland characteristics.  To address this challenge our core team consisted of wetland scientists (including council specialists), remote sensing scientists, data scientists and geospatial specialists.

Several machine learning models were explored with a Random Forest decision tree method chosen based on performance and the ability to tune model inputs carefully based on feature importance.  Active Learning was used to train the machine learning models; a methodology used to achieve high accuracy models using only the most essential training inputs.

RESULTS

With this approach our team have been able to detect wetlands within the district in a very short time frame (3 months) compared to conventional methods.  The results of the assessment are summarised as follows, including some illustrative images.

  • Average ML model accuracy was 86%

  • Average delineation accuracy of 78.6%

  • Detect wetlands of 100 m2 and larger

  • Mapped coastal including inland freshwater wetlands

  • Detected difficult detectable wetland types

  • Derived wetland likelihood tiers

THE OPPORTUNITIES

This approach provides a basis for prioritizing wetlands at risk of loss of extent or values. It is a very cost-effective method that can also utilise freely available regional imagery and training data from other regions may provide a head start and even a cost saving when transfer learning is applied. This approach can be applied region wide and further afield.  Additionally, the outputs are a very valuable information source that can guide resource consenting and environmental planning. It provides an understanding of the spatial extent and connectivity of wetlands on a landscape scale and serves as a very valuable resource for the identification of potential wetland restoration areas.

Marinus Boon, Service Leader – Environmental Remote Sensing, PDP

Matt Lythe, Managing Director, Lynker Analytics


Mapping the impervious surface and land cover in Auckland

Client: Auckland Council

Auckland Council have a requirement to map and monitor changes in land cover and the impervious surface across the city to support a range of activities including catchment planning, hydraulic and contaminant modelling, flood management, and evaluating the impact of proposed developments. 

The Council and its predecessor Auckland Regional Council have previously had maps of impervious surface prepared using remote sensing but not a city-wide multi-class data set that discriminates the built surface as well as vegetation, grass, bare earth and water down to a property scale.

In this project Lynker Analytics used Machine Learning to generate a detailed multi-class land cover map across the entire Auckland Council region (approx. 5,000 sq km) covered by the aggregate extent of two aerial photo surveys including the 2010-2012 survey at 0.5m spatial resolution and the 2017 survey at 0.075m spatial resolution.

Multi-class land cover, Central Auckland area

Our approach uses supervised Machine Learning (ML) models developed and trained by Lynker Analytics for standard specification orthophotography available in New Zealand. These models have also been used in Hutt City, Upper Hutt City, Tauranga City, Kapiti Coast District, Bay of Plenty, Whangarei District and Gisborne District.  ML models can be transferred from area to area or image set to image set but to perform optimally need to be fine-tuned on the target imagery used for modelling. 

In this project a DeepLab V3+ neural network model was trained to predict these classes.  The urban model was trained and run on the high resolution imagery while a rural model was trained on resampled high resolution imagery and then fine-tuned on the 2010-12 target imagery.   

The ML models and post processing generate a polygon feature class which includes eight land cover categories (building, roads, other impervious, grass, scrub/shrub, bare earth/sand/gravel, woody vegetation, water). Detailed Building outlines were generated using a similar but separate process.

Ancillary data such as kerblines, water bodies, and road centrelines were then incorporated within a multi-stage post processing and data assembly process.  Quality checks and validation exercises were run to ensure all features were representative and topologically correct. The model accuracy was then evaluated using a separate hold out set of ground truth data carefully selected and not used for training.  

Multi-class land cover, Devonport

Overall, the models performed well across all classes with an overall weighted average F1 score of 0.92. Aside from the Roads class which is sometimes modelled as paved (impervious other) the F1 scores are very good.  Also, across all classes the Precision and Recall were high and not too dissimilar which means the model is well balanced.

The detailed land cover models allowed us to map the composite impervious surface – comprising all the artificial structures—such as pavements, roads, sidewalks/footpaths, driveways and parking lots, as well as industrial areas such as airports, ports and distribution centres, all of which have considerable paved areas.  

Impervious surface, East Tamaki

The final data is an integrated land cover data set (including the composite impervious area) which is a 100% modelled data set derived from two separate orthophoto surveys. 

Impervious surface map at suburb scale

False positive classifications generally occur in adjacent classes for example Impervious surface is at times classified as Road or Scrub/Shrub classified as Vegetation or Grass or Bare Earth is classified as Impervious (e.g. compressed gravel).  The anthropogenic classes are generally high performing and suitable for modelling the composite impervious surface at a city, suburb and property level. 

Impervious surface map at street/property scale

The data also allows detailed mapping of tree and shrub canopy across the city which is helpful for planners to understand the cooling, stormwater absorption, and health benefits of urban trees for local residents.

Urban vegetation canopy, Auckland

This work extends previous modelling we have done using urban ortho-photography.  We were able to adapt the neural networks we have already built to this image data and multi-class output requirements which will enable future repeat modelling and development of a longitudinal data set of change in land cover and imperviousness across New Zealand’s largest city.   

Deliverables

  • Multi-class land cover GIS data

  • Impervious surface GIS data

  • Data accuracy and quality report

AI for the Environment in NZ - Report

Client: AI Forum NZ

AI for the Environment in Aotearoa New Zealand - a new report by the AI Forum of New Zealand was released at Techweek in May 2022.   This significant report provides an analysis of opportunities and benefits of applying artificial intelligence to support environmental sustainability in Aotearoa New Zealand. 

Matt Lythe from Lynker Analytics managed the research team that developed the report which included Antistatic, wildlife.AI and Tahito.

The report utilised the expertise of many people in the field to explore the huge possibilities for AI to assist with the collection, analysis, and modelling of environmental data at scale. It provides an overview of the current state of activity, and looks at the opportunities, barriers, and areas of action we need to take to realise a thriving ecosystem. This research was conducted at the request of the Ministry for the Environment (MfE) and Statistics New Zealand (Stats NZ), who have an important role in the environmental and monitoring system in Aotearoa New Zealand.

60 projects across the public and private sectors that specifically aim to improve environmental outcomes were analysed. These projects provided representative examples of existing R&D and production systems delivering insights about current capabilities, capacity and distribution across the public and private sector, application area, and overall end user utility of AI for the environment.  Several stand out projects were profiled including the land cover analysis of deforested areas conducted by the Lynker Analytics Consortium for MfE.

Case studies highlighted in the report

The research found that current projects engage a range of AI capabilities, concentrating in a few areas. For example, species recognition or identification is often used for projects that focus on preserving biodiversity. The overall state of our AI ecosystem in NZ was assessed at level two: active on the Gartner AI maturity model. At this level, there is active experimentation, mostly taking place in a data science context although there are some advanced outliers which are highlighted in the report.

The researchers noted that New Zealand's environment faces multiple threats and is besieged in numerous ways, mostly as a result of human actions. These threats include thousands of species threatened or at risk of extinction, shrinking wetlands, a warming climate leading to more regular droughts and extreme rainfall events and decreasing water quality.

The report also found that data on the state of the environment is fragmented and reliant on systems designed to support regional needs. It concluded that AI technology provides an important part of the solution to this problem and that we should look beyond the current methods of data collection, and determine whether ‘generational jumps’ that utilise more sensors, cloud computing, satellite imagery and other tools can assist at scale.

More information:

AI Forum website with summary and link to the report

AI for the Environment in Aotearoa New Zealand Report

Deliverables:

1.      Research report with key findings and recommendations.

Paddock detection with AI

Client: Farm Mapping Services

Farm management systems require paddock plans with detailed identification of bush, dams, drains, lanes, buildings and more. Farm Mapping Services provide detailed farm maps to farmers across Australia to support a wide range of activities including building paddock histories for stock and crop rotation, control of contractor charges and as a guide to stocking rates.

Digital paddock maps are a key input into these systems however this data is not always available, accurate or up to date. Lynker Analytics recently developed a supervised machine learning based system to identify, detect and delineate paddock boundaries from aerial photography for Farm Mapping Services.  The delineation and mapping system was tested using RGB imagery collected at ground sampling distance (GSD) of between 0.7 and 0.4m.

We built a convolutional neural network model with inspiration from the U-Net model architecture for semantic segmentation. Unlike traditional semantic segmentation where the task is to categorise areas of pixels as belonging to a particular class (such as “grass”,”road”,”building”), our objective was to find edges between areas: paddock boundaries. With some adjustments made to our model architecture and training process to meet the delineation requirements, we trained our model on aerial imagery using human captured boundary examples from a diverse range of farms from Tasmania, South Australia, Victoria and New South Wales.

Inference results from the model on two farms in Tasmania are shown below.  The brighter the line the more confident the model is.  These results show the model has learned simple and complicated multi-type boundaries well however some edges are not as obvious while there exist some false positives within paddocks.

RGB Image (left), model inference result (right)

RGB Image (left), model inference result (right)

Overall, we achieved a pixel based model accuracy of 92% - calculated by dividing the number of correct predictions by the number of total predictions. 

RGB Image (left), model inference result (right)

RGB Image (left), model inference result (right)

A multi-stage GIS post processing method was then used to derive paddock geometries that could be used within farm management systems.  This process included the following steps:

  • Raster cleaning,

  • Vectorisation,

  • Simplifying and Generalising,

  • Straightening,

  • Connecting and Joining Features,

  • Extracting a final boundary dataset.

Paddock boundaries derived from this process compared to paddocks mapped using manual methods are shown here.  The yellow region represents the area predicted by the model to be a boundary with the red centreline derived from this. These boundaries are subsequently processed using the method described above followed by manual QA to produce final paddock boundaries.

Manually mapped paddock boundaries (top) and predicted boundaries (bottom)

Manually mapped paddock boundaries (top) and predicted boundaries (bottom)

This workflow was implemented as a Cloud based ML and processing pipeline to be used on an ongoing basis by the Farm Mapping Services team. 

CEO of Farm Mapping Services Andrew Harrisson says

“this automated procedure will help accelerate our farm map update service by reducing the time needed to document farm boundaries, allowing us to focus on pasture management, irrigation and other farming optimisation activities”.

Lynker Analytics and Farm Mapping Services are continuing to invest in this area to improve these capabilities.

Migrating critical systems to the AWS Cloud

Client: Wellington City Council

As part of a broader “Smart Council” programme, Wellington City Council (WCC) has been steadily modernising and implementing greater resilience into its IT systems.  As part of this work, WCC has now migrated its entire data centre-based IT infrastructure into the AWS Cloud (Amazon Web Services).  This migration includes critical council applications such as the Pathway rates system, parking, consenting, asset and contractor management, which use database server or Geographic Information Systems (GIS) technology. 

Wellington City Council officials asked Lynker Analytics to migrate their existing Sybase and SQL Server database infrastructure and their ArcGIS GIS technology stack from existing environments to equivalent EC2 servers in the AWS cloud.  This was part of a major transformation to re-platform the entire IT infrastructure to AWS in order to reduce IT operational costs and increase infrastructure flexibility. The Lynker Analytics team worked in close partnership with WCC experts, Consegna and AWS.

nurn_bnry_wgtn_cityscape.jpg

A pragmatic approach to the migration was needed to balance architectural improvements and application upgrades with a risk-averse, efficient and cost-effective migration.  

“Our team initially supplied a discovery and documentation of the existing databases and GIS processes including versions, compute requirements, resources provisioning, application dependencies, users and more”, says Dave Lister, Principal Data Infrastructure.

This work involved understanding the current database server and GIS resource requirements and the complex database interconnections between applications.  A critical exploration area was to identify the equivalent EC2 instance types and resource for a like-for-like architecture and performance.

“We assisted in identifying the impact and limitations of the AWS platform when compared to the current environment and provided recommendations for handling integration and linkage issues.” Lister goes on to say.  Work was also carried out to optimise database allocations and to rationalise servers.

The project was completed late in 2020 with all systems successfully migrated. 

Working within the WCC agile, collaborative approach, the Lynker Analytics team managed the migration of database and GIS systems and undertook the necessary go-live testing and troubleshooting to resolve issues as they arose.  This included making any database server configuration changes needed to complete the transition to production.

Overall, this project has delivered a more resilient, scalable and secure data infrastructure which will position WCC to provide better services at a lower cost, ultimately resulting in enhanced services for Wellington’s ratepayers. 

Deliverables:

  1. Architectural advice mapping database and GIS systems, sizes and performance characteristics to the equivalent AWS services

  2. Migration of Sybase and SQL Server database servers and GIS application stack to AWS

  3. Go live support, system documentation and issue resolution.