Mapping metropolitan areas with machine learning

Client: Tauranga City Council

Tauranga City Council (TCC) maintain an ongoing programme to monitor change across their city to assist with a range of planning and infrastructure needs.

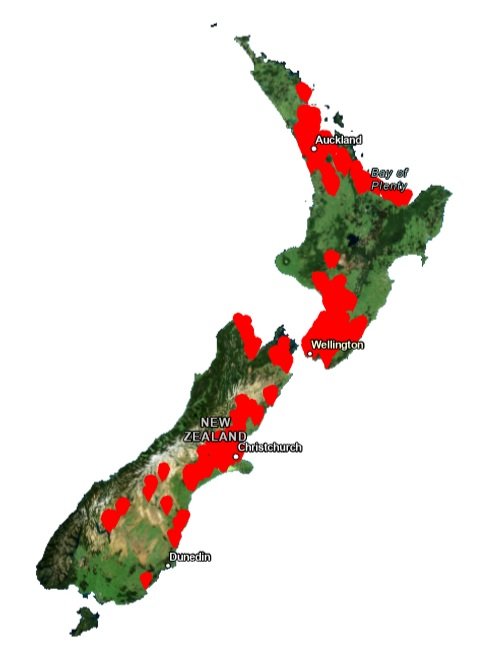
In late 2019 Lynker Analytics was awarded a contract to use machine learning to extract land surface classes from the most recent (2019) high-resolution aerial photography encompassing most of the TCC area (approximately 210 square km). This work was focused on the need to produce detailed land cover maps to inform hydrological imperviousness estimates and hydraulic roughness for overland flow for the city’s 2D stormwater models.

We used computer vision to extract high resolution multiple land surface classes from the aerial photography which had a spatial resolution of 0.10m. Eight Land cover classes were identified and mapped including:

  • Buildings

  • Road & footpath

  • Vegetation (trees and shrubs)

  • Scrub

  • Grass (open space without trees and shrubs)

  • Water

  • Sand/Gravel/Bare Earth

  • Other impervious surfaces e.g. driveways, car parks

A supply of existing Roads and Buildings was provided by TCC with machine learning used for change detection in these classes.

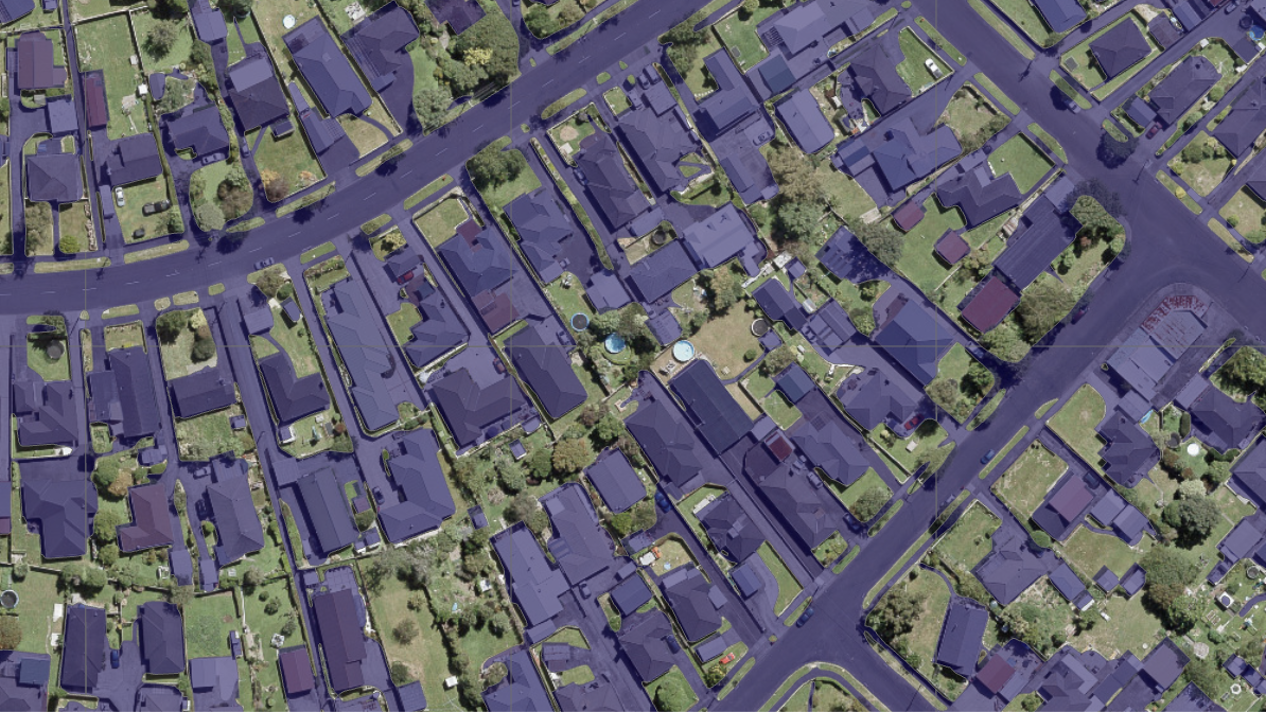
The example below shows the imagery alongside the classified land cover map in an area that includes residential, industrial, parkland and coastal environment.

tcc1.png

Python, Tensorflow and Keras were used to build neural network architectures to annotate, classify, segment and achieve object localization from the imagery. Our approach used Active Learning or ‘human in the loop’ computing – a form of supervised machine learning that requires only the most informative samples for training. This technique provides a pathway to rapidly create a highly specific dataset for training machine learning models whilst simultaneously training a model with this data.

For this project we used a specially designed software interface that uses iterative semi-supervised machine learning to optimize and minimize the amount of data needed to train industrial artificial neural network models.

Multiple inference cycles were run. Vectorisation and comprehensive post processing was then carried out. This included clipping, sliver detection, geometry size checks, vertex counts, criteria-based dissolve and eliminate tasks before full data re-assembly. Finally, a quality check and validation exercise was run to ensure all features were representative and topologically correct.

The models were then calibrated using a separate hold out set of ground truth data carefully selected and not used for training. A number of refinements were made to improve the definition in this quality control stage. Model accuracy was calculated using Absolute Accuracy, Precision, Recall and F1 scores.

Overall, the model results exceeded 90% for all eight land cover categories including up to 97% for some classes.

In residential areas the model is at its optimum as the land cover is generally a mix of buildings, footpaths, roads, grass, vegetation, and other impervious surfaces e.g. concrete, driveways, patios etc. This finer detail is well described in this high resolution ortho-photography and our models.

tcc2.png

In coastal, rural, farmland and horticultural areas there tends to be more heterogeneity in the land cover with the consequence that smaller polygons are generated as the model attempts to describe everything on the surface. There is also a mixed surface response at this resolution across rural land such as in this example below where predominantly pasture (light green) is interspersed with vegetation (dark green). Earthworks for new sub-divisions, roadworks as well as the sandy beach are shown in yellow.

tcc3.png

This work extended previous modelling we have done using urban ortho-photography. We were able to adapt the neural networks we have already built to this image data and multi-class output requirements using an optimum volume of hand captured features for training and ground truth.

Deliverables

  • Multi-class land cover GIS data

  • Data accuracy and quality report

Using AI to identify areas of deforestation and replanting

Client: Ministry for the Environment

Lynker Analytics with partners, Carbon Forest Services and UAV Mapping NZ Ltd were contracted by the Ministry for the Environment (the Ministry) in late-2019 to survey and classify around 7,500 distinct areas of potential forest loss across New Zealand.

cutover_ground.jpg

Deforestation is an important form of land-use change from a greenhouse gas perspective with assessments conducted in New Zealand every two years to meet international reporting obligations under the United Nations Framework Convention on Climate Change and the Kyoto Protocol.

In NZ, 40,000 – 50,000 hectares of forest is harvested each year with most areas replanted with a smaller proportion converted to another land use.

Between January and August 2020, the Lynker Analytics Consortium conducted an aerial survey of New Zealand using Cessna 172 aircraft flying at approximately 5,000 feet above ground level capturing over 30,000 high resolution vertical photographs with a spatial resolution of 0.25m.

forestrysurvey4.jpg

The imagery was georeferenced and then classified into land cover classes such as cutover (harvest area), plantation seedlings, grass/pasture, mature exotic and mature native forest using Machine Learning (ML). 

Multi-scale convolutional neural network (CNN) models were then used to classify each target into land cover units with a spatial resolution of 100 square metres. In deep learning, a CNN is a class of deep neural network that is most commonly applied to analysing visual imagery.

Over 15,000 multi-scale training annotations were used to train the models. The example below shows a training example with the left-hand image showing a 70m x 70m area of new plantation forest with the red box representing the right-hand image, which is a smaller area of 10m x 10m. 

seedlings1.png

For the neural network models, a patch-segmentation model was trained on the multi-scale image chip pairs.  Patch segmentation was used instead of U-Net (or similar) for semantic segmentation as this allowed us to gather training annotations quickly and it better described land use in forested areas by revealing planting patterns with individual trees separated by scrub or cutover.

From this we applied a geospatial data generalisation routine to filter out noise or speckle and then we used a multi-criteria iterative analysis to assign each area into dominant land cover categories broadly in line with the Emissions Trading Scheme - Geospatial Mapping Information Standard. 

Overall we achieved a combined overall model accuracy approaching 80% which given the heterogeneity in land cover is a good result which then enabled the model to be used as a land cover change detection system in concert with the multi-criteria analysis. Examples of the final classified results are shown below.

results1.png
result4.png
result3.png
result2.png

The automated monitoring system proved reliable in detecting deforestation, re-planting and other land cover changes exceeding one hectare.  It also enabled more rapid assessment of replant status used by the Ministry for reporting.   In total 7473 targets were surveyed with imagery, land cover polygons, dominant land cover and replant status attributes provided to the Ministry. 

Watch the officlal presentation of this report to MfE here. The technical report is available here.

Colorado Hazards Explorer

Client: Colorado Water Conservation Board

The Future Avoided Cost Explorer (FACE:Hazards) is a visualisation tool commissioned by the Colorado Water Conservation Board (CWCB) in partnership with other state and federal agencies in the US to help communities in Colorado examine the economic risks of climate change. 

cohazard3.jpg

The FACE:Hazards explorer displays results from a detailed study into flood, drought and wildfire risks in a warming climate.  This is presented as an interactive dashboard to help inform preparedness and resilience policies, support recovery and adaptation investments, and provide decision-makers with tools to quantify the growing cost of inaction.  It empowers communities to justify mitigation and adaptation investments using climate and risk-informed decisions.

FACE:Hazards measures the current and future impacts from flood, drought and wildfire across multiple sectors of Colorado’s economy. County-level damages are analyzed under current and 2050 climate and population conditions to explore the effects of unmitigated development and increased hazard intensity on certain economies.

In collaboration with Lynker scientists we developed an interactive dashboard using Tableau to explore how flood, drought, and wildfire may cause economic damages under a variety of climate and population scenarios.  Using this dashboard the user can adjust population and climate scenarios and visualise spatially and in economic terms the impacts of all of the hazard categories.

cohazarad1.png

We also developed a series of Esri storymaps that explain the methods used in the study including

1.      An overview of the overall approach

2.      Approach summary for flood

3.      Approach summary for drought

4.      Approach summary for wildfire

These pages include information on how we calculated expected annual damages for each of the sectors.  For example we used a model that computed crop production based on drought severity for all counties producing corn, wheat, hay, or sorghum.

cohazard2.png

The FACE:Hazards tool is important to Colorado because, until now, the State of Colorado did not have a tool to quantify future risk to climate hazards or the potential savings from strategic resilience. By creating this web-based, climate data-informed explorer, local governments can inquire, evaluate, and prioritize investments today to reduce economic vulnerabilities over the next three decades.

Deliverables:

  • Interactive tableau dashboard

  • Summary of method storymaps

  • FACE:Hazards graphic language

Rooftop solar value estimation

Client: Harrisons Energy and homes.co.nz

In a New Zealand first, homes.co.nz has partnered with Lynker Analytics, and New Zealand’s leading solar power provider, Harrisons Energy Solutions, to calculate, calibrate and display the annual retail value of residential solar systems for properties across New Zealand.

Using LiDAR data available from Toitū Te Whenua Land Information New Zealand, we have generated detailed digital models showing the solar potential across more than 1.9 million properties across New Zealand. Our models take into account the size, angle and orientation of the roof as well as shadows from nearby trees, buildings and hills. The example image below of the Auckland CBD shows the tremendous level of detail contained within the models.

central_city_solar.JPG

Solar receipt surface, Auckland Central Business District

Using roof outline data we extract from the model a unique solar receipt heatmap for every property - including all buildings. Each roof or building polygon generally has over 100 data points a (from 1 meter LiDAR resolution input data) and the rooftop heat maps allow you to understand where on your roof might be best suited to solar panels.

solarakld.png

Solar receipt heatmap visualised by property

Finally based on the distribution and intensity of the heatmap we were able to determine an annual estimate of power generation potential in kilowatt hours and dollar terms. We calibrated these calculations carefully using production data from Harrisons Energy. The solar estimate is based on the annual value a standard 3 kW or 5 kW system could generate using an average retail power price.

Harrisons solar estimate on homes.co.nz

Tom Lintern, Chief Data Scientist from homes.co.nz explains

the Solar Estimate provides an indication of the returns you can expect for your property from a solar investment.“

Coverage of 1.9M rooftop level solar estimates on homes.co.nz

homes.co.nz know that Kiwis are passionate about property and want to access as much data and content possible to help them make the best possible decisions for themselves and their families.

Phil Harrison, General Manager of Harrisons also says

“We are excited to partner with homes.co.nz and Lynker Analytics on this initiative. A solar system added to your home is an investment. It adds green features to your home and can increase the value of your home to potential buyers who see the benefits of solar. If you are a landlord, a solar system can make your property a lot more attractive to prospective tenants who will see the opportunity to reduce their energy bills.”

You can check out the solar heatmaps and estimates now freely available for 1.9m+ households on homes.co.nz.

Further reading: Solar power: an idea whose time has come?

Deliverables:

  • Solar heatmap raster image and tile service

  • Solar estimate database for every property

Impervious Surface Mapping

Client: AWA Environmental and Wellington Water Ltd

Water utilities require detailed land cover mapping in order to support long term planning and make effective asset management decisions.    Wellington Water and their partner AWA Environmental asked Lynker Analytics to use deep learning to generate high resolution impervious surface GIS data for Upper Hutt City and Lower Hutt City. 

Our team has also undertaken impervious surface mapping from vertical aerial photography using our models in Auckland, Tauranga, Gisborne and Kapiti.

AWA Environmental Ltd offer pioneering computer-based mathematical modelling tools to support a range of infrastructure planning needs from flood mitigation and environmental compliance to spatial planning and asset management.  These models greatly benefit from detailed land cover information. 

gisb1.png

Using our Active Learning framework and annotation libraries we trained convolutional neural network models to infer the composite impervious surface from high resolution aerial ortho-photography.  We considered the impervious surface to consist of the following: roads, footpaths, bridges, driveways, carparks, industrial land, other (including concrete and other materials adjacent to built structures). An example is shown below.

gisb2.png

Our Active Learning frameworks ensured we captured only the most useful and informative impervious feature examples needed to train the models.  The inference results (raster images) were then vectorised to produce polygons for review and validation.  This can be a time-consuming part of the process but we have been successfully using automated targeted exception management processes based on the properties of the geometries that greatly reduce human review workloads.

The inference results exceeded initial expectations in the speed of capture and in the ability to make contextual inference of features beyond whats possible using traditional remote sensing techniques.

occulded.png

For example, our neural networks correctly identify surfaces occluded by trees by understanding the context in the image.  In the example shown here the neural network has correctly inferred the existence of the driveway beneath the tree canopy.  In other cases where the canopy is more dense the pervious surface is prioritised over the continuity of the underlying artificial surface. 

The detailed raster and polygon data and inherent spatial statistics generated using this approach are highly effective to monitor the built environment.

gisb3.png

The annotations we have built up are now very well matched to the built surface and vegetation profile common in New Zealand towns and cities while our models can be tuned to the domain specific decision rules needed to deal with different surface emphasis settings.

The final spatial data, as shown here, are visually interesting and can be used to inform hydrological imperviousness and hydraulic roughness for overland flow for stormwater models. 

Deliverables:

-          Raster impervious surface image

-          Polygon feature data set describing impervious surface

-          Data Quality and Accuracy report